en
- EN
- UA


Data Visualization in Spiro: How to Work with New Widgets?

Easy access to relevant and aggregated data is both convenient and essential for managers at every level. That’s why it’s so important to be able to visualize and monitor business metrics, track changes, and respond promptly. To make this process even more flexible, we’ve added new functionality to Spiro. You can now create widgets and tailor them to your tasks, goals, and business areas. What’s new and why it matters — find out in the overview.
New dashboard
The new dashboard is a flexible environment where each user can conveniently work with data, create widgets, and customize them to their specific needs. Instead of fixed template solutions, it offers a personalized interface that easily adapts to your workflow — from daily operational tasks to strategic analytics.
The dashboard logic in Spiro has changed: instead of a single long feed of widgets, you can now create tabs for each business area. Sales, marketing, finance, logistics — everything can be divided and organized the way that suits you best. This allows you to group relevant metrics into distinct sections and quickly switch between them without unnecessary information clutter. For example, it’s convenient to separate daily tasks, departmental analytics, or important business metrics.
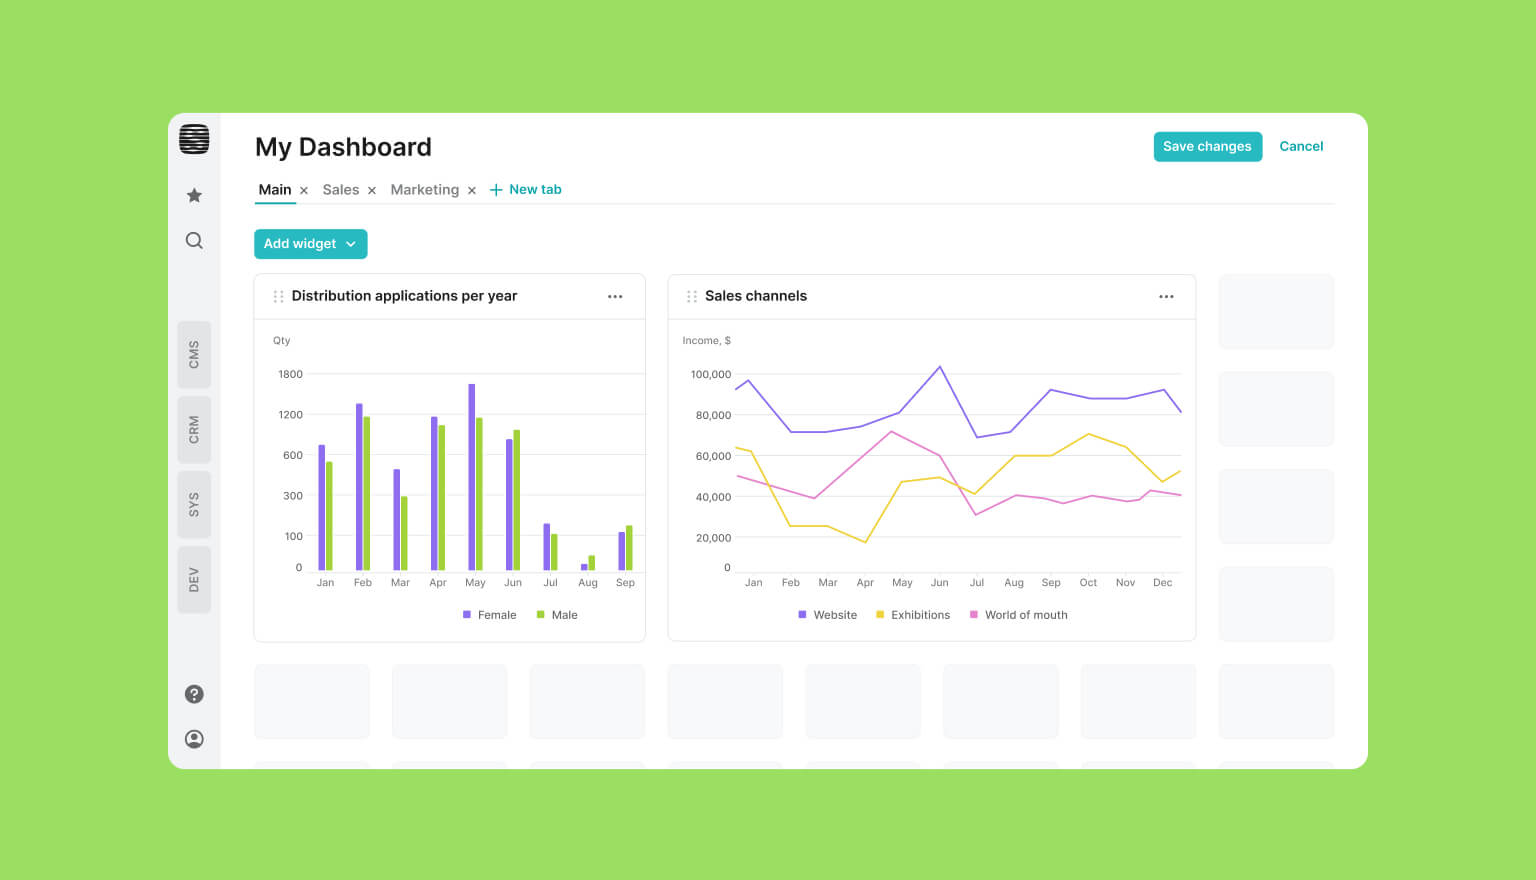
The new functionality's flexibility allows you to create a highly convenient, efficient, and logical space for data visualization. You can adjust the size and placement of widgets as needed. To ensure the dashboard looks clean and balanced, we've introduced an intuitive grid with automatic alignment of elements on the page.
Team and personal widgets
Each Spiro operator can create their own widgets or add widgets created by colleagues to their dashboard. All available widgets are divided into two categories — “My Widgets” and “Team Widgets.” This organization format simplifies searching and allows you to quickly assemble the needed set of metrics.
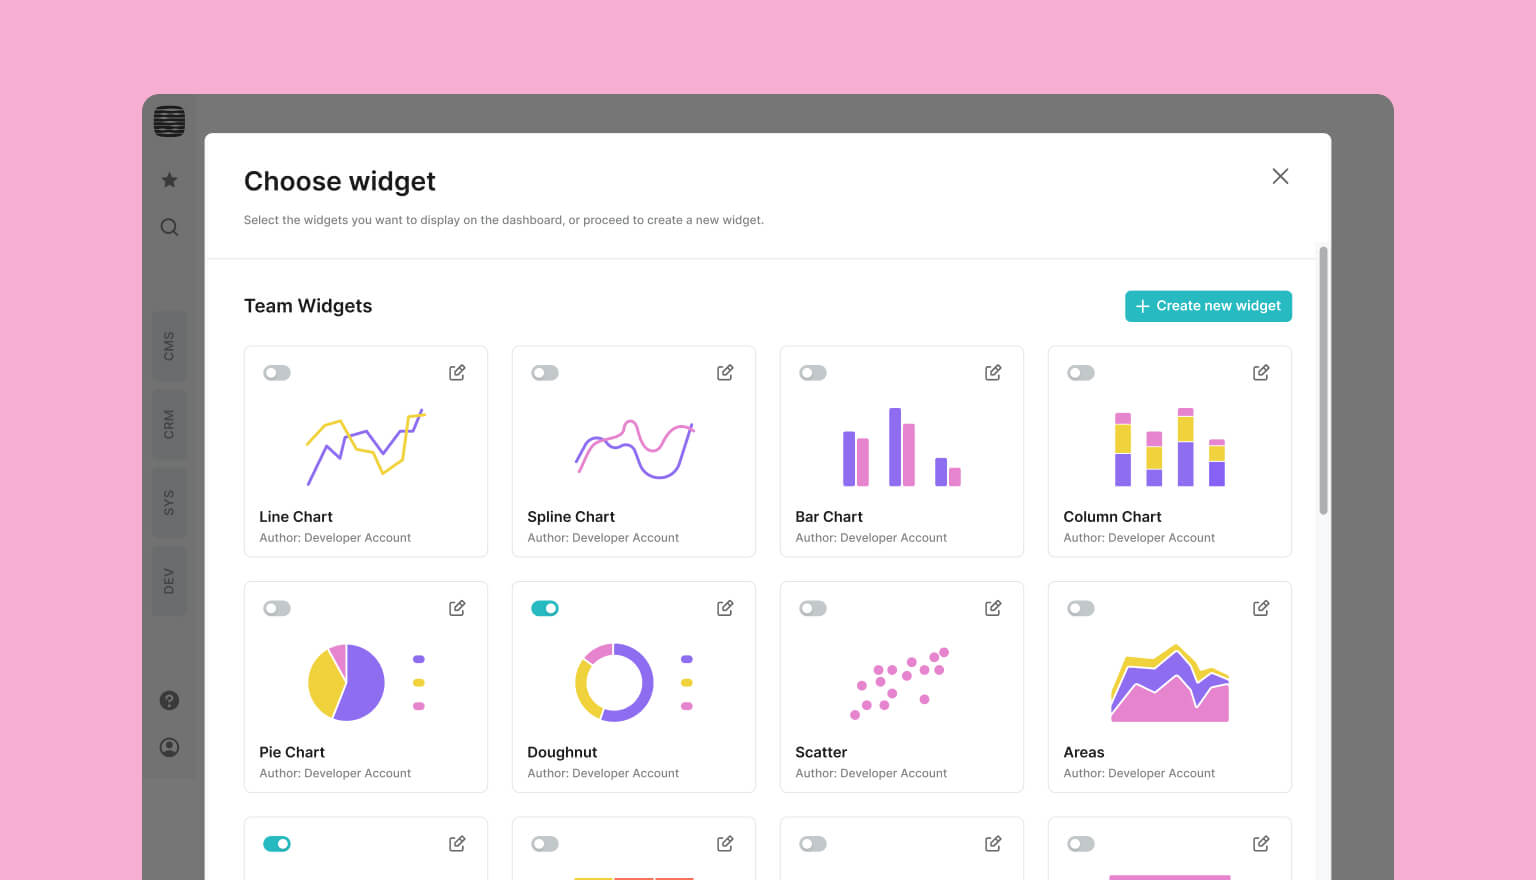
Widgets created by other operators are available to everyone by default, but the author can restrict access and specify who can see them. If an operator does not have access to the entities on which a widget is based, its content will also be unavailable. Each operator can add available widgets to their dashboard but can only edit those they have created themselves. This approach allows users to work within a single environment while customizing it to their own needs. For example, an employee in a specific department may track only personal metrics, while a manager monitors the metrics of the entire team.
Creating and editing widgets
Adding new widgets in Spiro is a simple and quick process. Just click “Create New Widget” on the dashboard and select the widget type. We have increased the number of available widget types, so the analysis of business metrics now covers even more scenarios. Once you’ve selected the type, fields and tabs for configuration will open.
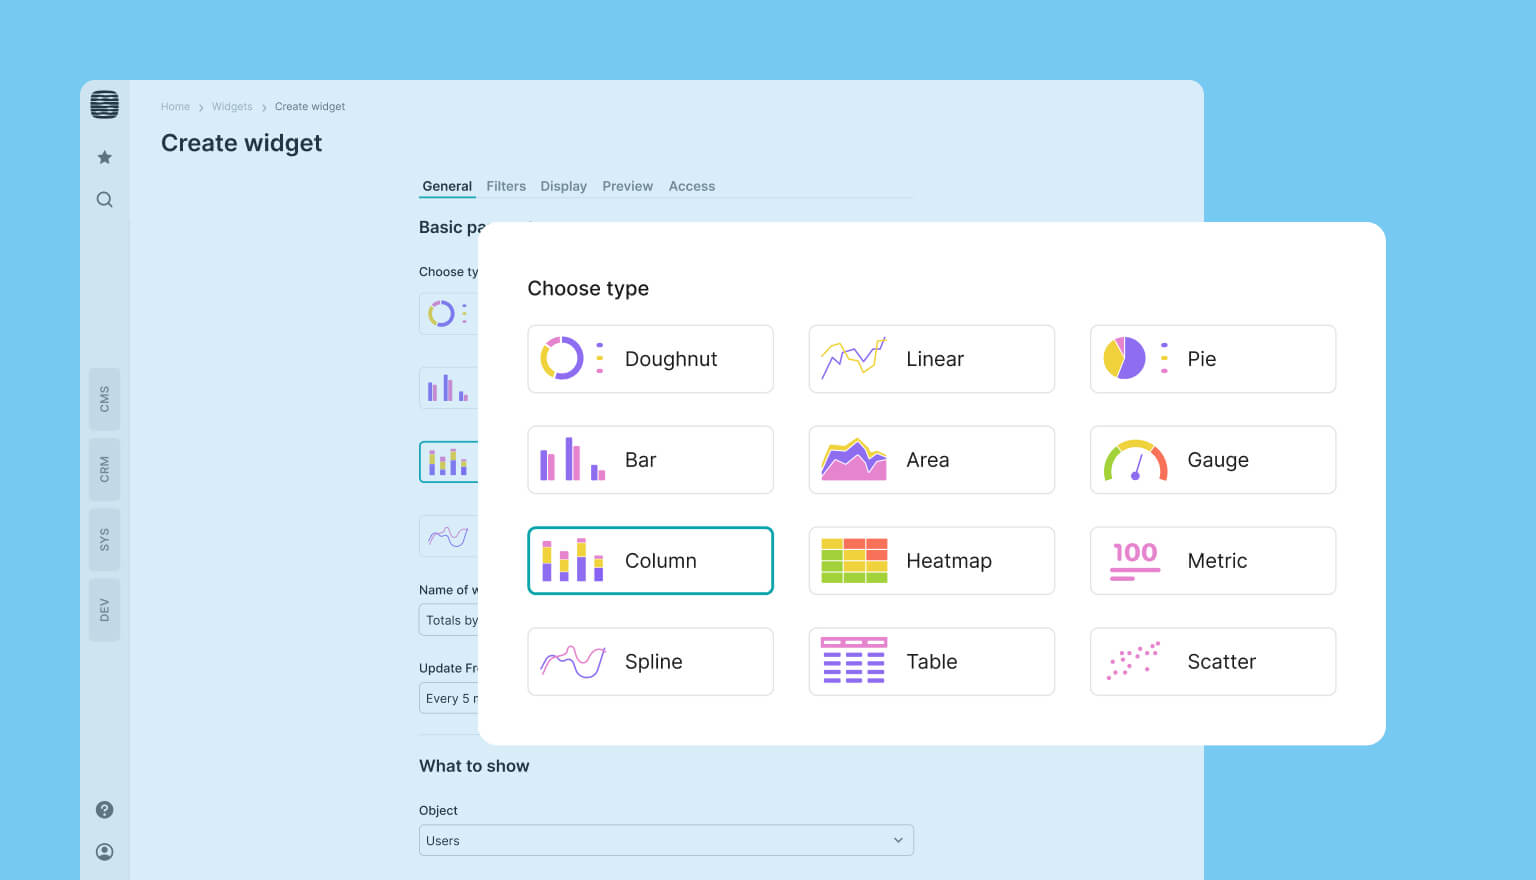
All fields in the widget creation form are divided into two logical sections: "What to show" and "How to show." First, you determine which data sources will be used to build the widget, and then you select how to visualize them. This approach makes configuration intuitive, even with a large number of parameters.
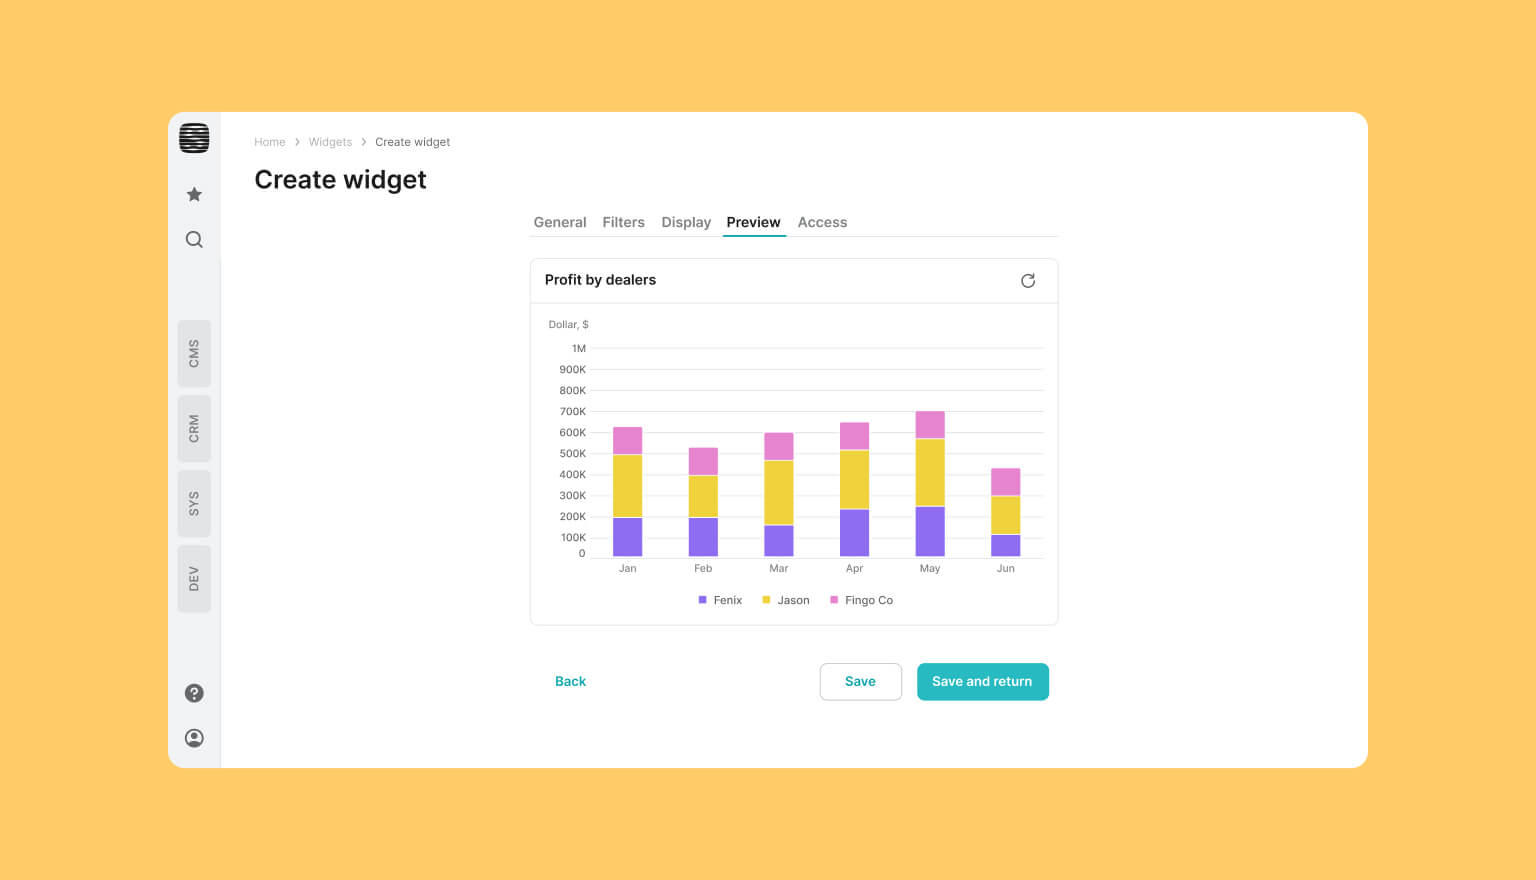
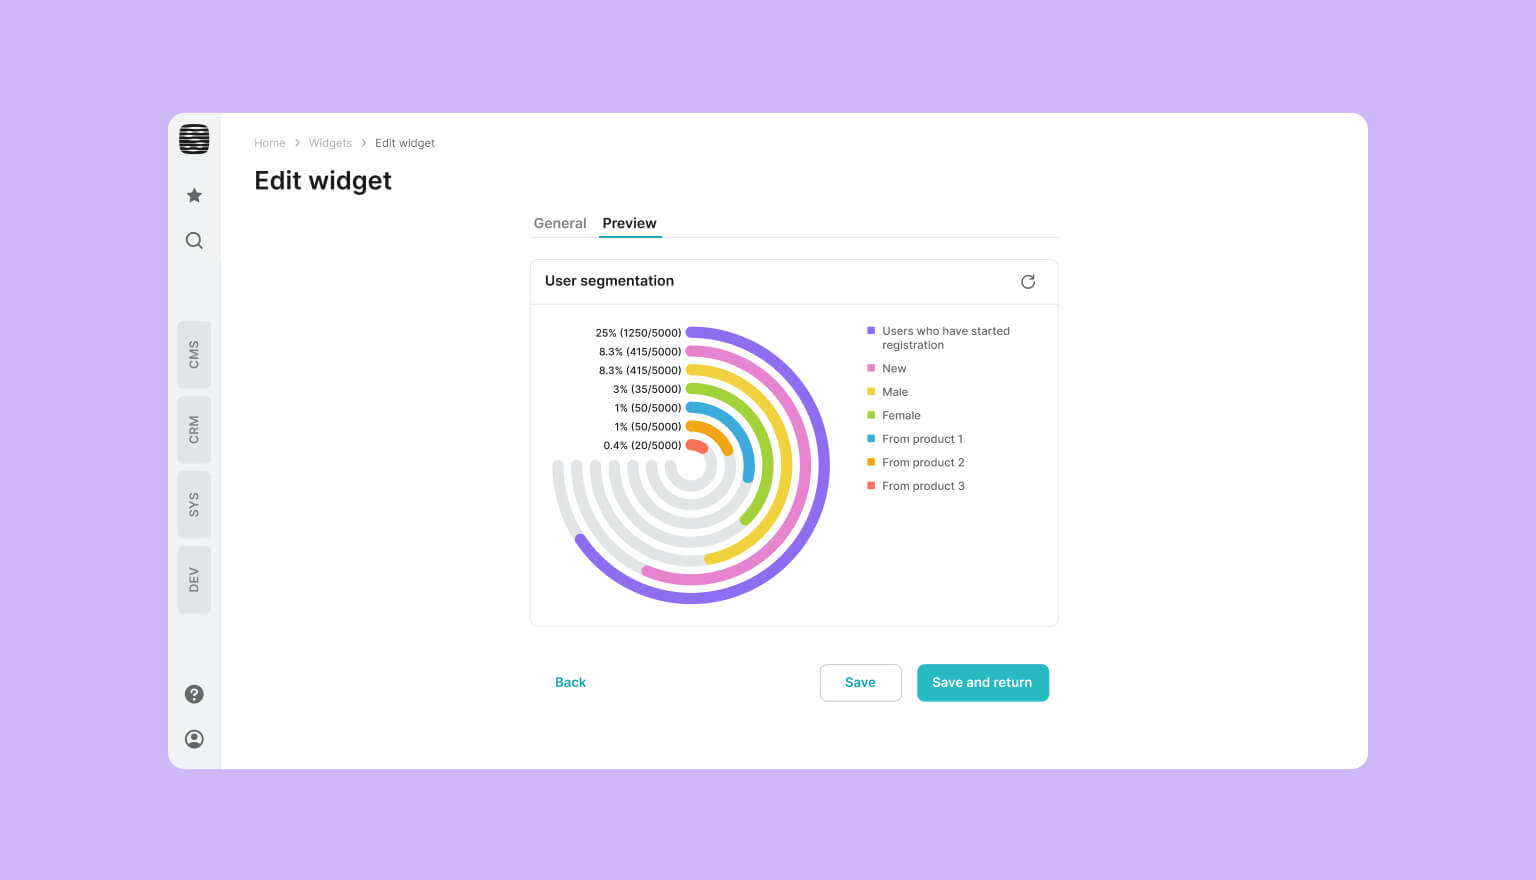
The widget editing process in Spiro is designed to let you immediately see the results of any changes. In the "Display" tab, you can adjust the appearance of the widget: change the date format, add labels, show the legend, or choose a color. All changes are instantly reflected in the "Preview" tab. This allows you to experiment with the structure and visualization without manually saving each change.
In the latest version of Spiro, we’ve expanded the list of system entities that can be used to build widgets. In addition to previously available Clients and Interactions, we’ve added Products, Sales Conditions, and Objects. This makes analytics more comprehensive and allows you to cover all key areas of your business. The more metrics accessible for analysis, the easier it is to monitor and implement changes in ongoing processes.
You can change the widget type even after it has been configured — for example, turn a line chart into a spline. In this case, most settings are saved automatically. You won’t need to create a new widget from scratch; it’s usually enough to manually adjust a few values if the new chart type requires a different data structure.
Thus, there have been major changes in the way the dashboard in Spiro works. The advantages include the ability to flexibly visualize all necessary data, create custom widgets, and instantly review configuration changes. With the wide variety of widget types available, you can cover even more business scenarios and collaborate on them with your team.
The new functionality will be useful for almost every business. It is equally suitable for companies working with large volumes of data and for those who primarily need to see key metrics in a convenient format. Regardless of the number of departments or the complexity of processes, with Spiro you can flexibly customize widgets to your tasks and quickly access all the necessary information.
If you’d like to learn more about data visualization in Spiro, please leave your contact details in the form. Our manager will reach out to you and share all the details about the capabilities of our low-code platform for business.


Bring your ideas to life with FreshTech
Hi! I'm Max Rybalko, Head of Business Solutions. Choose a convenient time, and we'll discuss how to turn your project
into reality